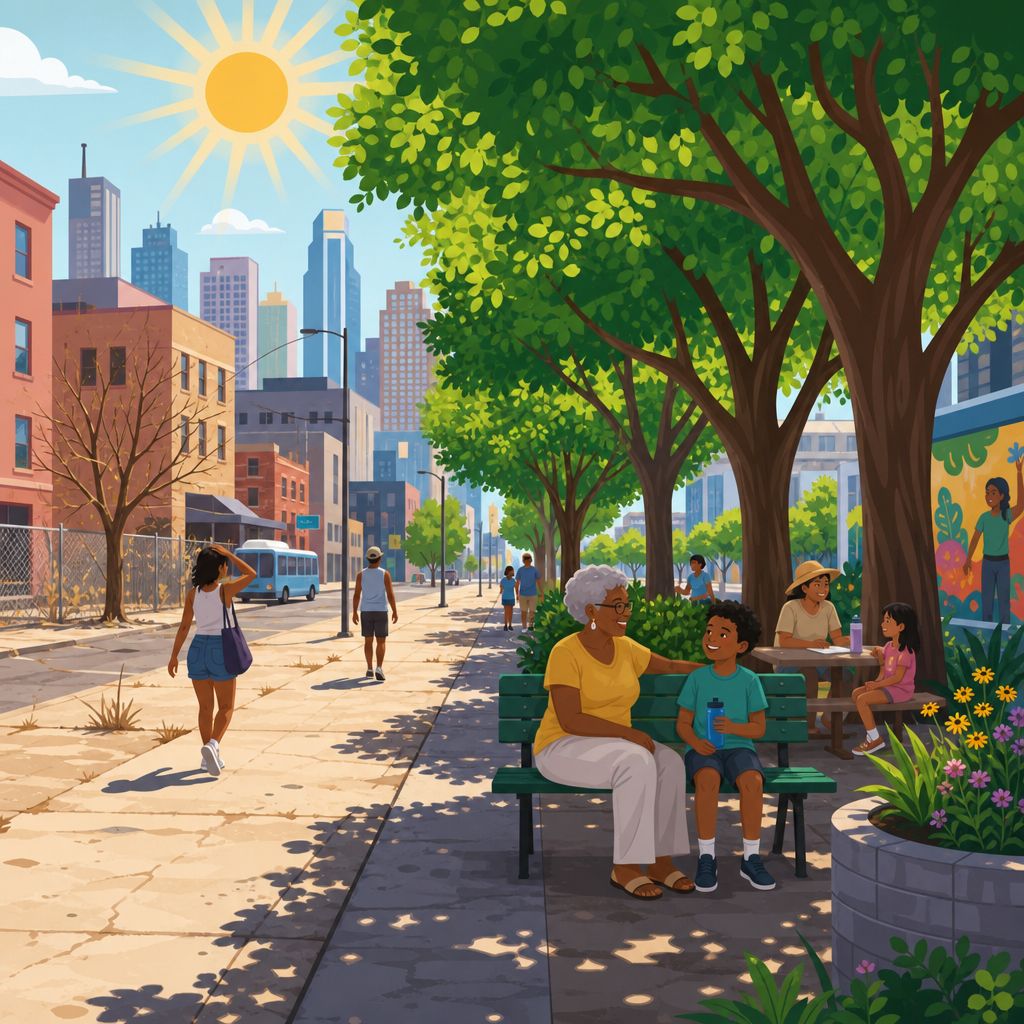
Shade equity in cities means distributing trees, canopies, cool roofs, and shaded public space according to heat risk and social need rather than treating every block the same. In practice, it asks a simple question: who is exposed to dangerous heat during daily life, and where can urban design reduce that exposure fastest? I have worked with municipal climate teams mapping hot spots, reviewing street tree plans, and aligning capital budgets with health data, and the pattern is consistent. Neighborhoods with the fewest trees, the most asphalt, older housing, and lower household incomes are usually the places where summer heat is most intense and the least avoidable. Prioritizing shade matters because extreme heat already kills more people in many countries than floods, hurricanes, or tornadoes in a typical year, and climate change is making urban heat islands stronger, longer, and more frequent.
To prioritize cooling where it is needed most, city leaders need a practical definition of need. Need is not only the highest afternoon land surface temperature on a satellite image. It also includes population vulnerability, exposure along walking routes, transit stops, schoolyards, public housing sites, outdoor work areas, and the quality of housing people return to at night. A shaded park in a wealthy district does not compensate for an unshaded bus stop outside a clinic in a heat-vulnerable neighborhood. Good shade equity planning therefore combines thermal data with social, health, and mobility indicators. It translates heat from an abstract climate issue into a public service question involving streets, schools, housing, public health, and maintenance budgets.
The stakes are large. Shade lowers mean radiant temperature, which often matters more to human comfort than air temperature alone. A mature street tree can cool pavement and building facades, while shade structures can reduce direct solar exposure immediately in places where trees will take years to mature. Cooler walking routes support transit use, children walking to school, and older adults reaching essential services safely. Businesses also benefit because shaded commercial streets attract foot traffic and make outdoor work more tolerable. The goal is not to plant randomly or chase easy wins. The goal is to deliver measurable heat-risk reduction first to the people and places carrying the greatest burden.
What Shade Equity Looks Like in Practice
Shade equity starts with a clear operating principle: equal spending is not equal protection. Cities that divide tree planting or cooling funds evenly across districts usually preserve existing disparities because hotter neighborhoods often need more intensive intervention, more irrigation support during establishment, and more right-of-way redesign to create rooting space. In my experience, the most effective programs define priority geographies first and then tailor the cooling toolkit to local constraints. A historic district with narrow sidewalks may need awnings, arcades, and cool pavement in addition to trees. A schoolyard with full sun may benefit from shade sails immediately while long-term canopy is established around the perimeter.
Several cities have shown how this works. Phoenix has used heat response planning to target bus stops, pedestrian corridors, and neighborhoods with low canopy and high heat burden. Barcelona has expanded climate shelters in schools and public facilities so residents have nearby cooled refuge during heat events. Los Angeles has combined urban forestry analysis with equity screens to direct investments to communities with low canopy cover and high vulnerability. These examples succeed when they move beyond a tree-count mentality. Counting trees planted is easy, but the better metric is heat exposure reduced for priority populations during the hottest hours of the day and evening.
Practical shade equity also means recognizing time scales. Trees provide the broadest co-benefits, including evapotranspiration, air quality improvement, habitat, stormwater interception, and mental health benefits, but they require years of care before they deliver full canopy. Built shade can be installed much faster at bus stops, schoolyards, playgrounds, sidewalks, and public plazas. Cool roofs and cool pavements can reduce surface temperatures substantially, though their effect on pedestrian heat comfort depends on context, albedo, glare, and surrounding shade. The strongest municipal strategies combine immediate relief with long-horizon canopy growth rather than treating these approaches as competing options.
How Cities Identify Where Cooling Is Needed Most
The best prioritization frameworks combine four categories of evidence: heat intensity, human vulnerability, exposure in daily routines, and implementation feasibility. Heat intensity is measured through land surface temperature, air temperature sensors, and increasingly mean radiant temperature modeling at pedestrian level. Human vulnerability includes age, chronic disease prevalence, disability, income, housing quality, and access to cooling. Exposure looks at where people actually spend time outdoors and indoors without adequate relief, such as walking corridors, transit access routes, school campuses, public housing grounds, and industrial edges. Feasibility covers available planting space, underground utilities, irrigation access, ownership, and maintenance capacity.
Land surface temperature maps are useful, but they can mislead if used alone. Parking lots may register extreme temperatures while nearby apartment residents suffer even more because of poor housing insulation and little night cooling. That is why many cities pair remote sensing with on-the-ground air temperature campaigns and community observation. The National Integrated Heat Health Information System and organizations such as CAPA Strategies have helped cities run mobile heat mapping projects that reveal neighborhood-scale differences. Those maps become more powerful when layered with the CDC Social Vulnerability Index, local hospitalization data, and tree canopy assessments from tools such as i-Tree, American Forests’ Tree Equity Score, or municipal GIS inventories.
| Planning input | What it shows | Why it matters for shade equity |
|---|---|---|
| Land surface temperature | Hot roofs, asphalt, and bare ground | Identifies urban heat island patterns and extreme paved zones |
| Air or pedestrian heat data | Actual conditions people experience | Captures block-level exposure missed by satellites |
| Canopy cover and shade access | Existing protection from solar radiation | Shows where daily routes and public spaces lack relief |
| Health and demographic indicators | Who is most at risk during heat events | Directs investment to vulnerable populations, not just hot places |
| Land use and mobility data | Schools, bus stops, sidewalks, senior centers, housing | Targets locations where cooling improves essential trips and services |
| Maintenance and site constraints | Utilities, soil volume, irrigation, ownership | Helps choose the right intervention and protect survival rates |
A strong map does not end the process; it starts it. Once priority zones are identified, staff should audit specific sites. I usually recommend beginning with three visible and high-use categories: schoolyards, transit stops, and walking routes to clinics or grocery stores. These places combine repeated exposure with a public mandate for access. Site audits should note solar orientation, hours of peak use, pavement extent, existing shelters, tree health, rooting volume, and conflicts with utilities or sightlines. The result is a ranked project list that can be funded through transportation, parks, housing, health, and resilience budgets rather than waiting for a single urban forestry line item.
Choosing the Right Cooling Intervention for Each Street and Space
Not every hot place should receive the same treatment. Street trees are often the highest-value intervention where there is sufficient soil volume, room for canopy spread, and a maintenance plan for establishment. Species selection matters. Cities should favor heat-tolerant, drought-adapted, site-appropriate species with proven survival in compacted urban soils rather than defaulting to a narrow palette. Diversity matters as well; relying too heavily on one genus increases vulnerability to pests and disease. Standards from the U.S. Forest Service, ISA best practices, and local arboricultural guidance should shape planting design, pruning cycles, and root-zone protection.
Where trees are not immediately feasible, built shade fills the gap. Bus stop canopies, shade sails over play areas, photovoltaic shade structures in parking lots, arcades, pergolas, and building awnings can all cut direct sun exposure quickly. The key is placement and geometry. A small shelter that shades only at noon may do little for a west-facing stop crowded at 5 p.m. Designers should model solar angles for local latitude and season, then size structures to cover waiting areas during actual peak use periods. Materials also matter: high-emissivity surfaces, ventilated roof forms, and non-glare finishes generally perform better for comfort and safety than simple dark metal covers.
Surface strategies require nuance. Cool pavements can lower surface temperatures, but if they increase reflected radiation in unshaded pedestrian areas, people may not feel cooler. Cool roofs help buildings and neighborhood heat balance, especially for low-rise housing and public buildings, but they do not replace street-level shade. Green roofs support insulation and stormwater management, though they usually provide limited public cooling unless combined with accessible shaded space. The best results come from integrated design. A corridor with trees, narrower asphalt exposure, shaded seating, cool roofing on adjacent buildings, and drinking water access will outperform any single measure used in isolation.
Policy, Funding, and Maintenance: The Hard Part That Determines Results
Most urban cooling plans fail not because the science is weak but because delivery systems are fragmented. Transportation departments manage streets, parks departments manage open space, housing agencies manage public sites, and public health offices handle heat alerts. Shade equity requires a shared capital strategy. I have seen projects move fastest when cities adopt a formal heat governance structure with named responsibilities, a target map, and a short list of priority assets. That allows a bus shelter program, a school modernization program, and a tree planting contract to work from the same equity criteria instead of running separate and inconsistent agendas.
Funding should reflect the full value of shade. Trees and built shade reduce heat risk, but they also extend pavement life, lower building cooling demand, improve walkability, and support local commerce. Those benefits justify using multiple funding streams: transportation grants, public health funds, utility partnerships, stormwater fees, school capital budgets, resilience bonds, and development impact fees. Some cities also revise zoning and street design standards so private development contributes to public cooling through setbacks, canopy requirements, shaded frontages, and parking lot shade rules. Policy should avoid unfunded mandates, however. Requiring canopy without ensuring soil volume, irrigation, and maintenance staffing often leads to low survival and public frustration.
Maintenance is the credibility test. A shade equity program that plants in the hottest neighborhoods but fails to water young trees through three summers is not equitable. Hotter, lower-income districts often have the toughest growing conditions, meaning they require more care, not less. Contracts should include multiyear establishment watering, inspection, replacement guarantees, and resident communication. Community stewardship helps, but it cannot substitute for municipal responsibility. Cities should publish survival rates, canopy growth, shelter uptime, and repair response times by neighborhood. That level of transparency builds trust and reveals whether investments are truly reducing disparities or just producing appealing ribbon cuttings.
How to Measure Success and Build Public Support
Success should be measured in reduced exposure, improved access, and durable assets. Useful indicators include canopy gain in priority tracts, percentage of bus stops with effective shade, shaded route coverage to schools and clinics, schoolyard shade area per student, tree survival after three and five years, and modeled reductions in mean radiant temperature. Public health indicators matter too, although they are influenced by many factors. Emergency calls, heat-related illness patterns, and worker safety incidents can help cities refine interventions over time. Resident feedback is equally important because local knowledge often identifies heat traps that standard datasets miss, such as long waits outside social service offices or west-facing apartment courtyards that remain dangerously hot after sunset.
Public support grows when residents can see and feel the benefit. Quick-build projects are powerful here. Installing shade at a busy stop, adding temporary sails at a school, or converting a treeless plaza into a shaded gathering space can demonstrate value before larger capital work is complete. Communication should be concrete. Explain how many minutes of afternoon sun exposure a project removes, how far residents must walk to reach shade, and why one neighborhood is prioritized first. This is not preferential treatment; it is risk-based public service delivery. If your city is shaping a sustainable urban development agenda, start with a heat and shade equity map, rank high-use sites, fund immediate and long-term measures together, and report results annually.
Frequently Asked Questions
What does “shade equity” actually mean in city planning?
Shade equity means planning cooling investments based on who faces the greatest heat exposure and health risk, rather than spreading trees, shade structures, or reflective surfaces evenly across a city. In practice, it starts with a simple but important question: which residents are most exposed to dangerous heat during their daily routines, and which places could be cooled quickly through urban design? That shifts the conversation from beautification alone to public health, climate resilience, and fairness.
In many cities, the neighborhoods with the fewest trees and the hottest pavement are also the places where residents have lower incomes, less access to air conditioning, higher rates of chronic illness, and fewer safe public spaces. People in these areas may wait for buses in full sun, walk longer distances to school or work, or live in apartments that trap heat overnight. Shade equity recognizes that those conditions are not random. They are often linked to long-term planning decisions, disinvestment, street design standards, and land use patterns that left some communities far more vulnerable than others.
Rather than asking whether every block gets the same number of trees or canopy structures, shade equity asks whether resources are reaching the people and places that need them most. That can include planting street trees on the hottest pedestrian routes, adding shade at transit stops, cooling schoolyards, redesigning public housing landscapes, installing shade sails in parks with little canopy, and targeting reflective or green roofs where indoor heat risk is highest. The goal is not equal distribution on paper. It is meaningful reduction in real-world heat exposure.
How do cities decide where shade and cooling interventions should go first?
The strongest approaches combine heat data, health data, and daily-use patterns. Cities often begin by identifying urban heat hot spots through satellite imagery, land surface temperature analysis, or on-the-ground heat mapping campaigns. But temperature alone is not enough. A truly effective prioritization process also examines social vulnerability indicators such as age, income, housing conditions, existing tree canopy, asthma and cardiovascular risk, access to cooling centers, and whether residents depend on walking or transit during the hottest parts of the day.
From there, planners look at where people are exposed in everyday life. A residential block with low tree cover matters, but so do the routes children take to school, the sidewalks leading to clinics and grocery stores, playgrounds, senior centers, bus stops, and public housing courtyards. The practical question is not just where it is hottest, but where heat combines with routine human activity and limited alternatives. A bus stop with no shade in a high-risk neighborhood may deserve higher priority than a less-used area with similar temperatures.
Many municipal climate teams use layered maps to rank opportunity zones for action. Those maps may combine canopy gaps, extreme heat, population vulnerability, pedestrian volumes, and capital project schedules so that cooling improvements can be integrated into planned street work, park upgrades, or roof replacements. This helps cities move faster and spend smarter. The most successful strategies are not just data-rich; they are operational. They connect analysis directly to budgets, maintenance plans, planting feasibility, and project timelines.
Why isn’t planting more trees everywhere enough to solve urban heat?
Trees are one of the most powerful cooling tools cities have, but they are not a one-size-fits-all solution and they do not deliver benefits instantly. Large, healthy canopy can dramatically reduce surface temperatures, cool sidewalks, improve comfort, and support neighborhood livability. However, young trees take years to mature, and some streets have limited soil volume, overhead utilities, narrow sidewalks, or underground infrastructure that makes large-scale planting difficult. In the hottest neighborhoods, residents often need relief much sooner than a long tree-growth timeline can provide.
That is why shade equity usually requires a broader toolkit. Shade structures at transit stops, covered playgrounds, cool roofs, reflective pavements, shaded waiting areas, pocket parks, and redesigned schoolyards can all reduce heat exposure faster in places where tree planting is constrained or where immediate protection is needed. In dense corridors, a combination of trees and built shade often works better than either alone. Public space design matters too. A shaded bench, protected crossing, or covered queue area can make a measurable difference for seniors, children, outdoor workers, and transit riders.
It is also important to think beyond installation. Trees need watering, pruning, and long-term care. If a city plants aggressively without funding maintenance, survival rates may drop and the equity goals may not be achieved. A smarter strategy is to match the intervention to the site, the time horizon, and the population at risk. Trees remain central, but they work best as part of a coordinated cooling plan that includes quick wins, durable infrastructure, and sustained stewardship.
How does shade equity connect to public health and climate resilience?
Extreme heat is one of the deadliest climate hazards, and its health impacts are unevenly distributed. Heat increases the risk of dehydration, heat exhaustion, heat stroke, respiratory stress, cardiovascular complications, and worsening of chronic illness. It can also affect sleep, mental health, school performance, and work productivity. People who are older, very young, medically vulnerable, unhoused, or living in poorly cooled housing are especially at risk. When cities target shade and cooling resources toward these groups and the places they rely on, they are making a direct public health investment.
Shade equity also strengthens resilience because it reduces strain before a crisis escalates. Cooler streets and public spaces can lower exposure during heat waves, improve walkability, and provide safer access to transit, services, and community facilities. Cooling interventions can complement emergency response systems by reducing the baseline risk in neighborhoods that face repeated extreme heat. This is especially important as heat events become more frequent, last longer, and overlap with power outages, poor air quality, or drought conditions.
From a policy perspective, shade equity helps cities move from reactive heat response to preventive design. It links climate adaptation with health departments, parks agencies, transportation planners, school districts, and housing authorities. Instead of treating heat as a temporary summer inconvenience, it frames heat as an infrastructure and equity issue that can be addressed block by block. That makes the city safer not only during extreme events, but in the everyday conditions that shape long-term wellbeing.
What are the biggest mistakes cities make when trying to create more equitable shade?
One common mistake is relying on citywide averages or simple canopy targets without looking closely at who is actually exposed to heat and where. A city may report an increase in overall tree canopy while the hottest pedestrian corridors, public housing sites, or transit-dependent neighborhoods remain largely unchanged. Broad metrics can hide deep disparities. If the goal is shade equity, success has to be measured at the scale of lived experience, not just municipal totals.
Another mistake is treating community engagement as an afterthought. Residents often know exactly where the unbearable bus stops are, which playgrounds are unusable in summer, and which sidewalks feel unsafe because there is no shade for several blocks. If planning teams rely only on desktop analysis, they may miss the routes and spaces that matter most in daily life. Good engagement improves project siting, species selection, maintenance planning, and trust. It also helps avoid interventions that look promising on paper but fail in practice.
A third mistake is separating cooling goals from implementation systems such as capital budgeting, maintenance, and interagency coordination. Cities may produce excellent heat maps and equity frameworks, then struggle to translate them into funded projects. Lasting progress usually requires embedding shade priorities into street redesigns, park renovations, school improvements, roof replacement cycles, transit upgrades, and asset management plans. Without that integration, cooling remains a pilot instead of becoming standard practice.
Finally, some cities underestimate the need for maintenance and accountability. Shade equity is not achieved when a project is announced; it is achieved when vulnerable residents experience cooler, safer conditions over time. That means tracking survival rates of plantings, monitoring the performance of shade structures and cool surfaces, updating risk maps, and revisiting priorities as neighborhoods change. The most effective programs treat shade as essential urban infrastructure and manage it with the same seriousness they bring to transportation, housing, and public health.