
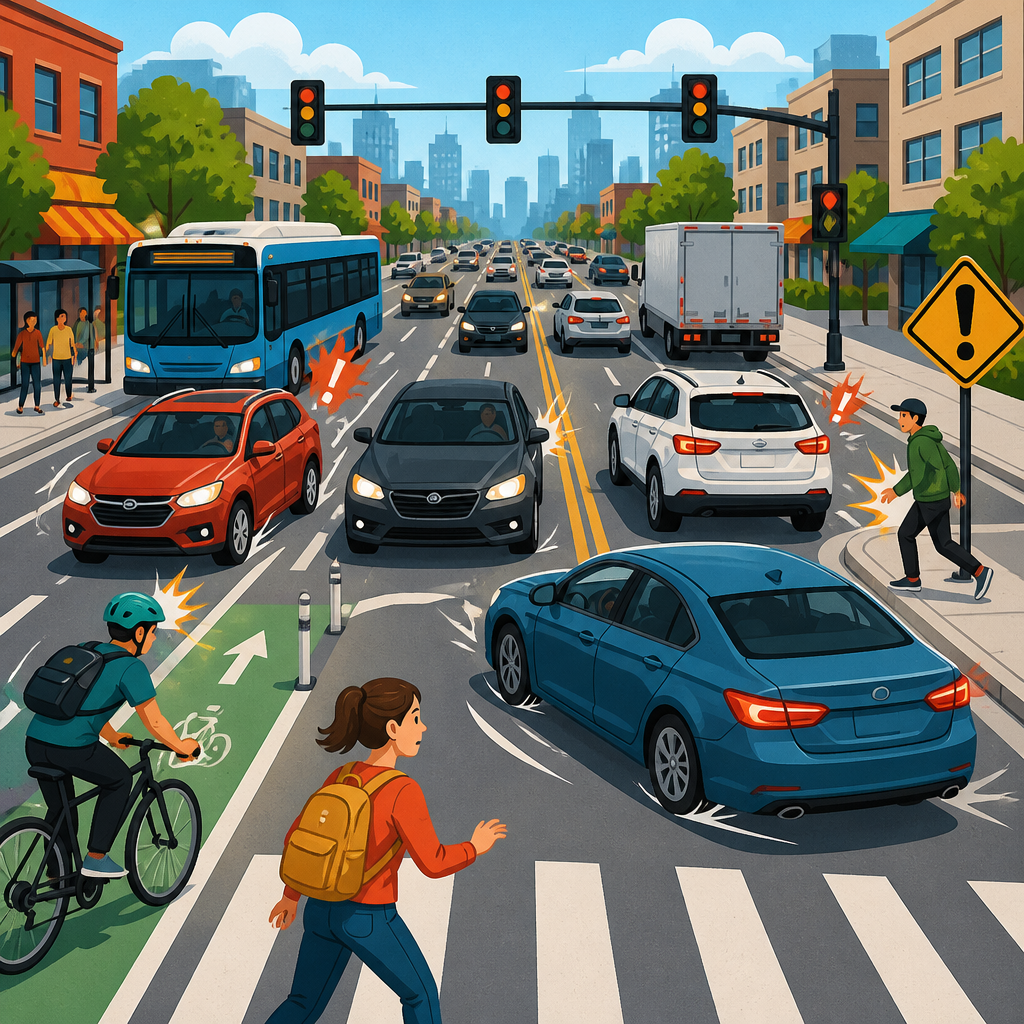
High-injury traffic networks are the small share of streets where a large share of severe and fatal crashes occur, and understanding them is now central to effective urban planning and policy. In many cities, roughly 5 to 15 percent of the street system accounts for more than half of traffic deaths and serious injuries, which means safety problems are not random or evenly distributed. A high-injury network, sometimes called an HIN, is typically identified by mapping corridors with the highest concentration of fatal and severe crashes involving people walking, biking, using transit, riding motorcycles, and driving. The term matters because it shifts public discussion away from isolated incidents and toward system design, operating speed, land use, and enforcement patterns.
I have worked on corridor safety reviews where the same arterial appeared year after year in crash dashboards, and the pattern was unmistakable: wide lanes, long crossing distances, permissive turning movements, frequent driveways, and bus stops placed on fast multilane roads. Residents often described these streets as dangerous long before engineers published maps. Their lived experience usually matched the data. That overlap is important. A credible high-injury network program combines police crash records, hospital injury data when available, speed studies, exposure measures, and direct observation. It treats severe injury as a preventable outcome tied to policy choices, not as an unavoidable cost of mobility.
The safety problem on high-injury traffic networks matters because these corridors concentrate harm in places that also carry daily necessities: jobs, schools, clinics, grocery stores, and transit routes. In lower-income neighborhoods and communities of color, the burden is often worse because legacy road design prioritized vehicle throughput over local access and protection. State highways that function like city streets are a common example. They move regional traffic but cut through dense urban districts, creating conflicts at every intersection. The result is a compounding policy failure: the streets with the most people and destinations can become the least forgiving when something goes wrong.
At its core, the issue is kinetic energy. Human bodies tolerate only limited impact force. A person struck by a vehicle at 20 miles per hour has a far better chance of survival than one struck at 40. That is why speed management sits at the heart of any serious response. But speed is only one part of the network problem. Geometry, signal timing, curb management, lighting, transit stop placement, maintenance, and post-crash care all influence outcomes. A hub article on this topic therefore needs to connect the full policy landscape: how cities identify high-injury networks, why these streets become dangerous, what interventions work, how agencies prioritize funding, and how success should be measured over time.
How high-injury networks are identified
Cities usually identify a high-injury network by analyzing several years of crash data and filtering for fatal and severe injury events rather than all collisions. That distinction matters. A low-speed fender bender in a parking lane does not demand the same response as a pattern of pedestrians suffering life-changing trauma at multilane intersections. The strongest methods use five years of geocoded crash records, severity coding based on state definitions, and rate calculations that account for segment length. Some agencies also incorporate hospital discharge or emergency medical services data to correct for underreporting, especially for pedestrian and cyclist injuries that never appear in police databases.
Technical choices affect the map. Kernel density analysis, sliding-window corridor scoring, and crash frequency thresholds can produce different boundaries. In practice, good programs publish methodology clearly, update the map on a fixed cycle, and let the public inspect corridors street by street. San Francisco, Seattle, and Portland helped popularize this approach by focusing investment where severe crashes clustered. The policy advantage is straightforward: limited capital dollars can be directed to corridors with the highest risk of death and serious injury rather than spread thinly across politically favored projects. The map becomes a budgeting tool, a communication tool, and a performance baseline.
Why these corridors become so dangerous
High-injury corridors are dangerous because they combine exposure, speed, and conflict in the same place. The classic pattern is a wide arterial with four to seven lanes, frequent curb cuts, bus activity, turning vehicles, and long signal cycles that encourage speeding between intersections. These roads often sit in commercial strips or older urban neighborhoods where many short trips happen on foot. People cross midblock because destinations are close together and marked crossings are far apart. Drivers, meanwhile, receive visual cues that the road is built for fast travel. That mismatch between land use and road design is one of the most reliable predictors of severe injury.
Design details compound the risk. Large curb radii allow faster turns. Slip lanes create free-flow movement where pedestrians expect yielding. Channelized right turns increase crossing distance and divide driver attention. Multiple threat crashes occur when one vehicle stops for a pedestrian but a driver in the next lane continues through. Left-turn conflicts are especially lethal on multilane arterials, which is why protected left-turn phasing and median refuges can produce outsized safety gains. Nighttime conditions matter too. Poor lighting, faded markings, and unlit bus stops make vulnerable users harder to see, especially for older drivers whose night vision is reduced.
Operations also matter more than many people assume. A corridor can have decent sidewalks and still perform badly if signals are timed almost entirely for vehicle progression. Long waits encourage risky crossings. Short pedestrian clearance intervals penalize slower walkers. Transit riders may have to cross immediately after alighting because stops are placed far from protected crossings. Freight deliveries can block sight lines. Ride-hail pick-ups can spill into travel lanes. When cities review these streets block by block, they usually find not one fatal flaw but a stack of small design and management decisions that together raise impact speeds and increase the chance that an everyday mistake becomes a catastrophic injury.
Who bears the burden
The burden of danger on high-injury networks is not shared equally. In city after city, severe crashes cluster in neighborhoods with lower household incomes, higher rates of walking and transit dependence, older adults, and residents with disabilities. These populations often rely on arterial streets because that is where transit service, affordable retail, and public services are located. Yet those same roads may have the fewest protected crossings and the highest operating speeds. From a policy perspective, this creates a civil equity issue as much as a transportation issue. Safe access to daily needs should not depend on owning a car or avoiding certain corridors.
Children and older adults face distinct risks. Children make impulsive movements and have limited ability to judge vehicle speed. Older adults may need more time to cross and are more vulnerable to injury at any impact speed. People using wheelchairs or mobility devices encounter inaccessible curb ramps, drainage grates, and broken surfaces that force them into conflict zones. Motorcyclists and bicyclists face severe consequences when lane widths, pavement quality, and turning behavior are not managed carefully. Effective policy therefore treats the high-injury network not as a driver-only safety problem but as a multimodal public health challenge affecting different users in different ways.
What interventions work best
The most effective interventions on high-injury traffic networks are those that reduce speed, simplify conflicts, and shorten exposure. Road diets are a leading example. Converting a four-lane undivided arterial to three lanes with a center turn lane can lower crash rates while preserving access, especially on corridors carrying moderate traffic volumes. Protected bike lanes, raised medians, curb extensions, leading pedestrian intervals, and hardened centerlines all change driver behavior in ways that engineering guidance has repeatedly validated. The Federal Highway Administration and the National Association of City Transportation Officials have documented strong safety performance for many of these treatments when applied on the right street.
Quick-build projects deserve special attention because they let agencies act before a full capital reconstruction. Using paint, modular curbs, flexible posts, signal retiming, and daylighting at intersections, cities can test changes within months instead of waiting years. I have seen corridors where a quick-build median and left-turn restrictions reduced dangerous weaving almost immediately. Not every temporary treatment survives heavy traffic or poor maintenance, but the approach is invaluable for urgent risk reduction and public learning. When paired with before-and-after speed data, conflict studies, and community feedback, quick-build pilots can build the case for permanent concrete upgrades.
| Intervention | Primary safety effect | Best use case |
|---|---|---|
| Road diet | Reduces speeding and lane-changing conflicts | Four-lane arterials with moderate volumes and frequent left turns |
| Protected left-turn phase | Reduces angle and pedestrian turn conflicts | Intersections with recurring left-turn injury crashes |
| Raised median | Controls access and provides pedestrian refuge | Commercial corridors with many driveways and long crossings |
| Leading pedestrian interval | Improves pedestrian visibility before turning vehicles move | Signalized intersections with heavy foot traffic |
| Automated speed enforcement | Lowers operating speeds consistently | Corridors with chronic speeding and limited police capacity |
Enforcement and education can support engineering, but they are not substitutes for safer design. Traditional traffic enforcement often produces short-lived speed reductions and can create unequal impacts if not carefully governed. Automated speed enforcement, where authorized by law, is generally more consistent and less discretionary, though privacy, due process, and revenue use need clear rules. Education works best when tied to a specific change, such as alerting drivers to a new transit lane or no-turn-on-red restriction. The governing principle is simple: if a corridor remains forgiving of high speeds and complex conflicts, messaging alone will not solve the underlying safety problem.
How agencies should prioritize action
Agencies should prioritize high-injury network action by combining crash severity, equity indicators, speed evidence, and project readiness. A corridor with repeated fatal pedestrian crashes near senior housing and frequent transit stops should outrank a corridor with many minor collisions but little severe injury risk. This sounds obvious, yet capital programming often still rewards jurisdictional convenience, pavement cycles, or political visibility over safety need. The best transportation departments create a formal scoring framework and publish it. They also coordinate with transit agencies, public health departments, school districts, and state highway authorities, because many of the most dangerous urban corridors are controlled by multiple entities.
Funding strategy matters. Near-term safety fixes can often come from maintenance, signal, and operating budgets, while larger redesigns require capital improvement plans, federal safety grants, or state programs such as Highway Safety Improvement Program funding. Successful cities package projects so that resurfacing triggers striping changes, signal replacement triggers pedestrian timing upgrades, and utility work becomes an opportunity to rebuild corners or medians. This mainstreaming approach is more effective than treating safety as a boutique initiative. When every repaving or signal project on the high-injury network must evaluate speed and crossing risk, the safety program scales.
How success should be measured
Success on a high-injury network is measured first by reductions in deaths and serious injuries, but waiting only for crash totals can delay needed course correction. Leading indicators are essential. Agencies should track 85th percentile speeds, yielding rates, red-light running, pedestrian delay, crossing compliance, and transit stop accessibility before and after changes. Serious injury trends should be normalized over multiple years because random variation can obscure real improvement on short timelines. Public reporting should distinguish between citywide outcomes and corridor-specific outcomes so decision-makers can see whether interventions are working where risk is most concentrated.
Measurement should also account for unintended effects. Diversion onto residential streets, freight access problems, emergency response concerns, and maintenance burdens can all emerge after redesign. These issues are manageable, but only if agencies monitor them openly. The strongest programs publish dashboards, evaluation memos, and design adjustments instead of declaring victory after ribbon cuttings. In my experience, public trust grows when officials say, “Here is what changed, here is what improved, and here is what still needs refinement.” High-injury network policy works best as a continuous management discipline, not a one-time map or slogan.
The safety problem on high-injury traffic networks is ultimately a solvable systems problem. A small portion of the street network produces a disproportionate share of fatal and severe harm because street design, operating speed, land use, and management decisions concentrate risk there. Once cities identify those corridors clearly, the path forward becomes practical: focus investment where severe crashes cluster, redesign streets to reduce speed and conflict, and measure results with both crash outcomes and leading indicators. This approach is more disciplined than reacting to tragedies one by one, and it is fairer because it addresses the places where residents face danger every day.
The core lesson is that severe traffic injury is not merely the result of individual error. People make mistakes in every transportation system. The policy question is whether the street network turns ordinary mistakes into funerals, permanent disabilities, and lifelong trauma. High-injury network planning answers that question directly by identifying the corridors with the greatest harm and treating them as urgent public infrastructure priorities. It also forces agencies to confront inequity, since the worst corridors often serve communities that have received the least protective investment despite relying most on walking, transit, and shared public space.
For urban planning and policy, this topic belongs at the center of street governance, capital budgeting, and interagency coordination. Cities that make progress do not wait for perfect data or complete reconstruction budgets. They retime signals, daylight corners, add refuge islands, manage turning movements, deploy quick-build materials, and institutionalize safety review in every resurfacing project on the network. Then they evaluate, refine, and build permanent upgrades. If you are shaping policy, start by mapping your high-injury network, publishing the criteria, and aligning every available project dollar with the goal of preventing the next severe injury before it happens.
Frequently Asked Questions
What is a high-injury traffic network, and why does it matter so much?
A high-injury traffic network, often shortened to HIN, is the relatively small portion of a city’s street system where a disproportionate share of severe and fatal crashes happens. In many communities, just 5 to 15 percent of streets account for more than half of all traffic deaths and serious injuries. That pattern matters because it shows that traffic harm is not random. It is concentrated, predictable, and often tied to specific roadway designs, traffic volumes, travel speeds, and land-use conditions. In practical terms, a high-injury network helps city planners, transportation agencies, and policymakers focus attention where it can save the most lives.
The importance of an HIN is that it turns safety from a broad, abstract concern into a measurable, place-based problem. Instead of spreading resources evenly across an entire city, officials can identify the corridors and intersections with the greatest risk and prioritize them for improvements. This approach supports more effective use of limited public funding, clearer decision-making, and stronger accountability. It also helps residents understand why some streets feel more dangerous than others and why certain areas need urgent intervention.
How do cities identify a high-injury network?
Cities usually identify a high-injury network by analyzing crash data over several years and mapping where fatal and severe-injury collisions are concentrated. Transportation departments often combine police crash reports, hospital injury data, roadway characteristics, traffic volumes, speed information, and land-use patterns to build a clearer picture of risk. The goal is not simply to find streets with the highest number of minor incidents, but to isolate the corridors where the most serious harm occurs. Because severe crashes can vary year to year, agencies commonly use multi-year datasets to avoid overreacting to short-term fluctuations.
Once data is assembled, analysts look for recurring geographic patterns. They may rank corridors by the number of people killed or seriously injured, calculate crash rates, or identify clusters at intersections and along arterial roadways. In many cities, the resulting network includes major commuter routes, commercial streets, and wide multilane corridors where high speeds mix with frequent turning movements, pedestrian crossings, bicycle activity, and transit access. The process is increasingly data-driven, but good HIN planning also includes community input, because residents often know where near-misses, dangerous crossings, and routine speeding occur even before official data fully reflects the risk.
Why are severe crashes concentrated on a small percentage of streets instead of spread evenly across a city?
Severe crashes tend to cluster on a limited share of streets because roadway danger is shaped by design, speed, and conflict points, not chance alone. The streets that appear on high-injury networks are often major arterials built to move large numbers of vehicles quickly through dense urban environments. These corridors may have multiple travel lanes, long crossing distances, limited pedestrian refuge, frequent driveways, complex intersections, and signal timing that prioritizes vehicle throughput over human safety. When high speeds are combined with many people walking, biking, driving, and taking transit in the same space, the likelihood of deadly outcomes rises sharply.
Another reason concentration occurs is that some streets create repeated exposure to risk all day long. Commercial corridors, school routes, transit streets, and regional connectors attract heavy use from many different types of travelers. If those places lack safe crossings, protected bike facilities, traffic calming, or forgiving design, the same hazards affect thousands of people repeatedly. That is why high-injury networks are so useful: they reveal the structural conditions that make severe crashes more likely and show that the problem is often embedded in the physical and operational design of the transportation system itself.
What kinds of safety improvements are typically used on high-injury networks?
Safety improvements on high-injury networks usually focus on reducing speeds, simplifying conflict points, and making vulnerable road users more visible and protected. Common strategies include road diets, protected bike lanes, curb extensions, raised crosswalks, pedestrian refuge islands, leading pedestrian intervals, improved lighting, tighter corner radii, upgraded signal timing, median barriers, and automated speed enforcement where permitted. On high-speed corridors, agencies may also redesign lane configurations, shorten crossing distances, restrict certain turning movements, or introduce transit and freight treatments that improve operations without encouraging dangerous speeds.
The most effective interventions are generally systemic rather than cosmetic. A new sign alone rarely solves a serious design problem. Streets that repeatedly produce fatal and severe injuries often require physical changes that force safer behavior and reduce the consequences of inevitable human mistakes. This is a key principle behind modern safety approaches such as Vision Zero and the Safe System framework: people will make errors, so streets should be designed so those errors do not become deadly. When cities apply this mindset to HIN corridors, they can produce measurable reductions in serious crashes while also improving comfort, access, and equity for the people who use those streets every day.
How does focusing on a high-injury network improve urban planning and transportation policy?
Focusing on a high-injury network improves urban planning and transportation policy by helping leaders connect safety goals to real-world locations, budgets, and performance metrics. It allows agencies to direct investments to the streets where the need is greatest, rather than relying on reactive or politically uneven project selection. That makes safety planning more strategic and more transparent. It also supports stronger coordination across departments, since HIN corridors often involve issues beyond transportation alone, including public health, land use, housing access, transit reliability, emergency response, and environmental justice.
From a policy standpoint, an HIN framework helps cities set priorities that are easier to defend and evaluate. Officials can establish measurable targets, track outcomes over time, and update corridor strategies as conditions change. It also makes it easier to align capital planning, resurfacing schedules, transit improvements, and development review with safety objectives. Perhaps most importantly, focusing on a high-injury network reinforces the idea that traffic deaths are preventable. By identifying where the greatest harm occurs and addressing those corridors intentionally, cities move away from treating severe crashes as isolated incidents and toward a planning model centered on systemic risk reduction and long-term public safety.


